This article was published in the March 2019 edition of the Canadian Moneysaver magazine
If there is one thing the stock market can be counted on to do, it’s this: it will test you. Bull markets are easy. Bear markets strip away the security of rising account balances. Like the playground bully who sneaks up behind you and pulls your pants down – you are exposed. How comfortable are you when all you have left to show is your investment plan? Do you even have an investment plan?
At the time of writing this article, the markets are swooning. But this is what markets do. Am I concerned? Not at all. The majority of our family’s investments are in BTSX stocks which means big, profitable, dividend-paying companies. No matter what the market does, they are still big, profitable, dividend-paying companies – the kind of stocks we are quite happy to purchase more of while they are on sale.
If you are tempted to change your strategy in the midst of a market downturn, it was probably not the right strategy for you. Let me explain why dividend investing – and BTSX in particular – is right for me.
A strategy for DIY investors
Like most DIY investors, I am looking for a plan with the following characteristics :
- Low cost
- Easy to execute
- Low time commitment
- Does not depend on forecasting
- Track record of superior returns
These days many new DIY investors are gravitating toward indexing. This is certainly an improvement over paying high MER’s on actively managed mutual funds, but it is far from being the only rational, low-cost, low-maintenance approach for DIY investors. If you are looking for a strategy that is nearly as easy with a long reliable record of superior returns in the range of 10-12%, a dividend-based strategy like Beating the TSX might be for you.
BTSX: a history of outperformance
For new readers, Beating the TSX was originally published in the Canadian Moneysaver by David Stanley in the late 1990’s (and continued by Ross Grant in recent years). With data going back to the late 1980’s, the strategy now has a 30-year track record. Over that time, the method has returned an average of 12.33% annually. The benchmark index has returned an average of 9.40% (dividends included).
Figure 1 shows the rates of return over different time periods.
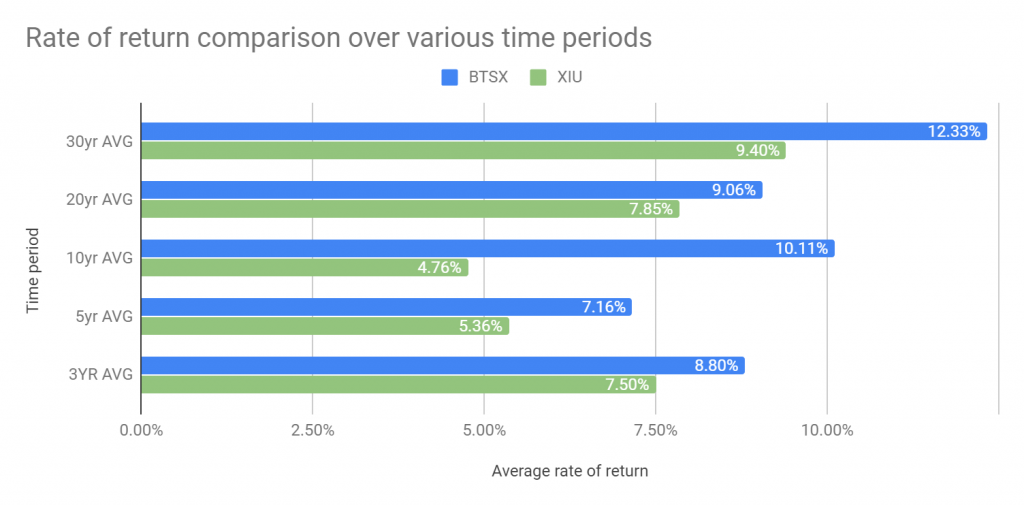
*We compare our results to XIU because it is an investable index fund tracking the TSX 60 index, which is our benchmark
As you can see, the BTSX method beat the index in every one of the time intervals. But what does a 2.9% difference in rate of return mean over time?
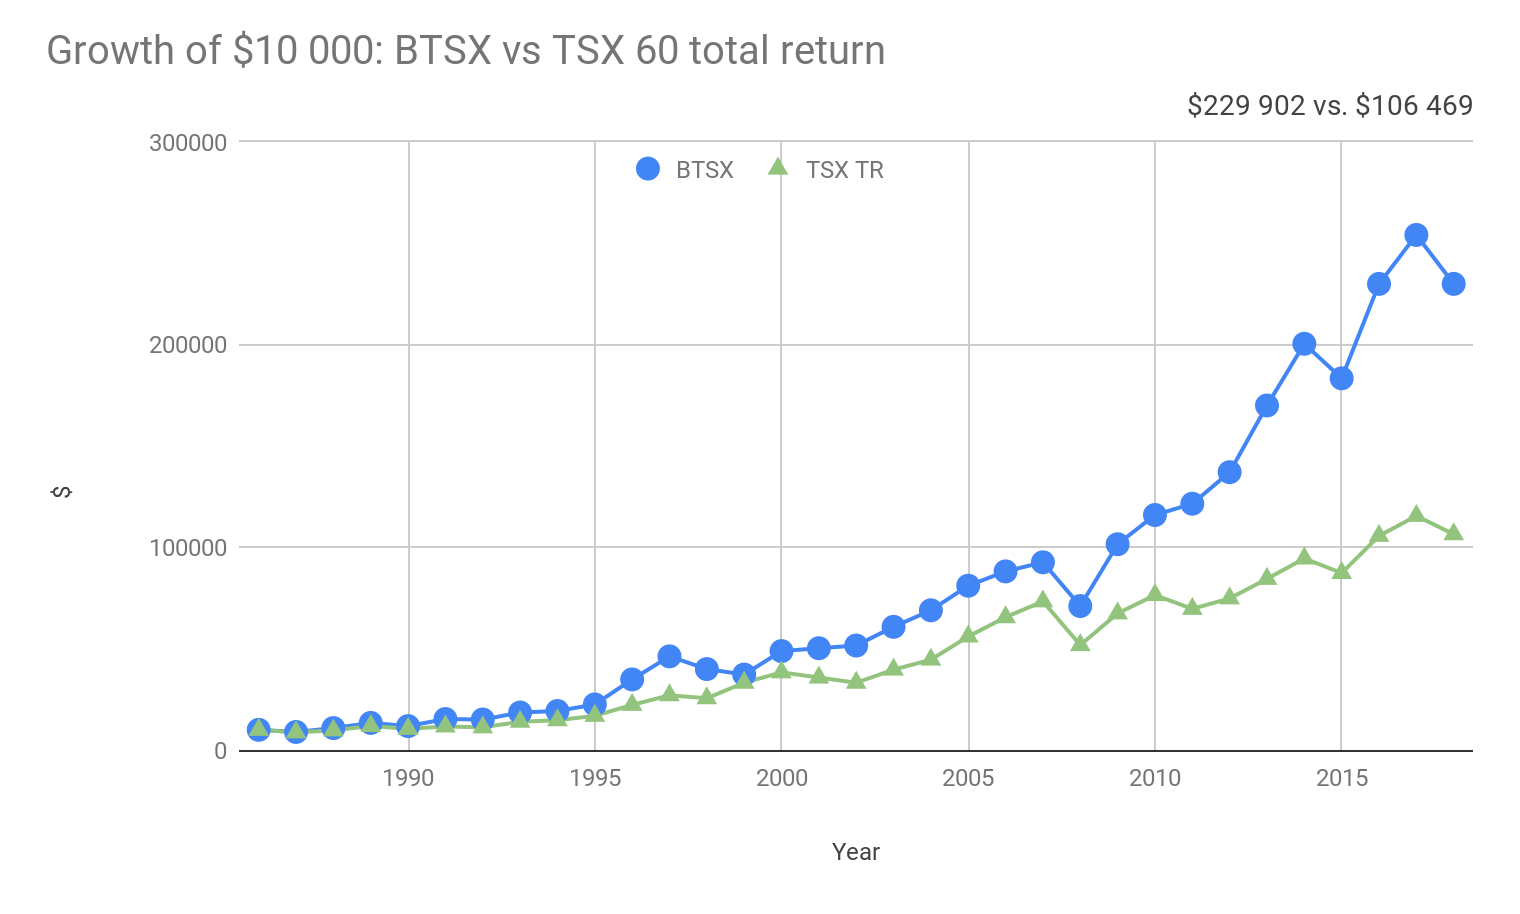
Figure 2 shows the growth of $10 000 using the BTSX method vs investing in the index (total return) over the last thirty years. That 2.9% average difference in annual rate of return compounded over a few decades would have more than doubled one’s net worth.
Figure 2: A 30-year comparison of BTSX vs. the benchmark index
How BTSX works
One of the things that convinced me to start using this strategy ten years ago is that the method is completely transparent and reproducible. In other words, anyone can do it by following the following steps:
- List the stocks on the TSX 60 Index by dividend yield*
- Select the top ten yielding stocks of the index provided they have a history of consistent dividend payments. Usually these will be “TURF” stocks (telecoms, utilities, REITs, and financials)**
- Purchase these equities in equal parts and hold for one year at which point the list is regenerated and the process is repeated.
*Note: the TSX has changed the organization of their indices occasionally. The TSX 60 is the most recent collection of Canadian blue-chip companies.
** REITs currently lack the market capitalization to appear on our list but can easily be added separately for the purposes of diversification
This simple method results in a portfolio of companies with several appealing characteristics:
- They are large (and usually very stable)
- They have a high dividend yield
- They usually have a long history of stable and growing dividends
- They are often purchased when their stock price is depressed (hence the high dividend yield)
Reflecting on 2018
As usual, last year’s portfolio was concentrated around telecoms, utilities and financials. To some this lack of diversification is a weakness. I see it as a strength. These are the sectors that contain large, profitable, dividend-paying companies. It is exactly this concentration that allows us to avoid the junkyard of small, unstable and unprofitable companies that could otherwise be a drag on our returns.
Having said that, after accounting for dividends, 2018 was one of the rare occasions when the BTSX method underperformed relative to its benchmark. After accounting for dividends, BTSX was down 9.5%, whereas the TSX 60 index was down 7.8% – a 1.7% difference. Table 2 shows the list of individual stocks and their annual returns.
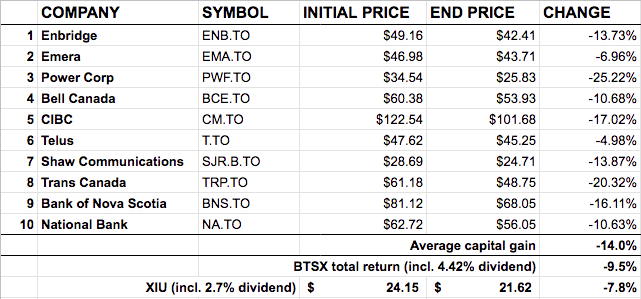
*XIU is an investable index fund based on the total return of the benchmark TSX 60 index
Is it time to abandon the plan? Not at all! Even the best investment plans will have periods of underperformance (and these are often followed by outperformance). Abandoning a sound plan during an inevitable period of lackluster returns will sabotage your long term success. An example from recent history illustrates this point.
A lesson from the past
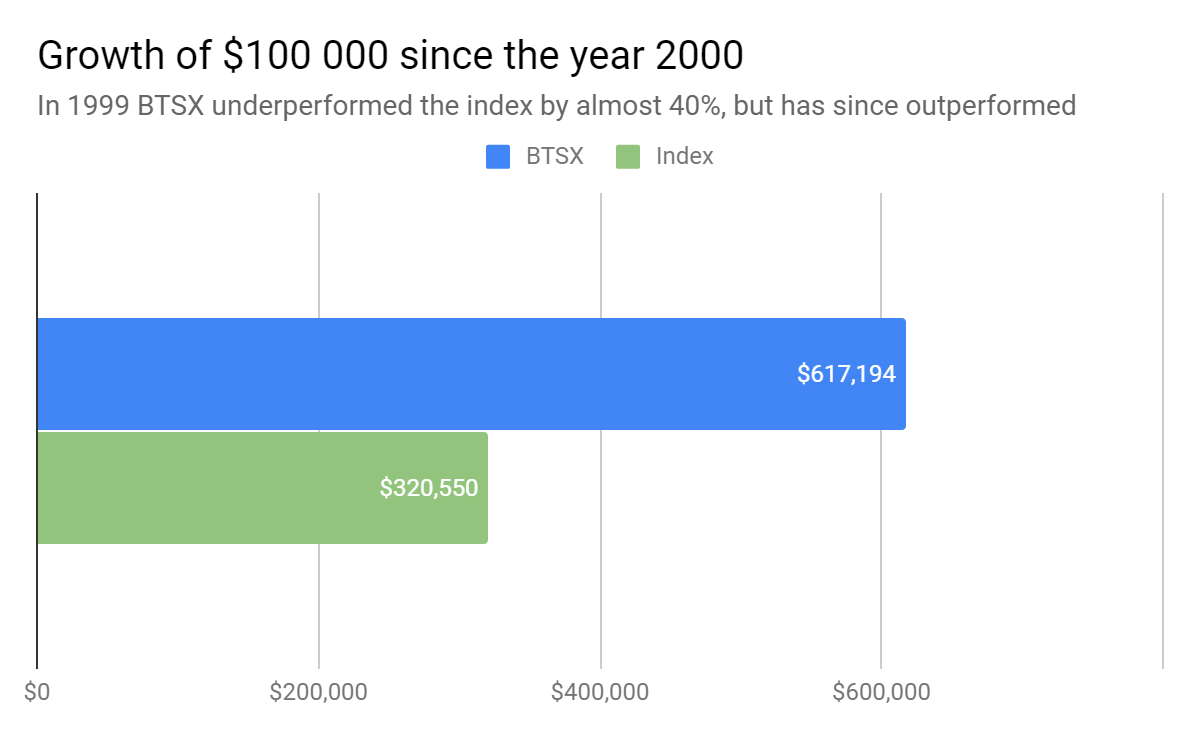
In 1999, BTSX underperformed the index by almost 40%. Of course, the tech bubble was fully inflated at this time but if one had ditched BTSX for an index fund, one would have missed out on a nearly 4% advantage over the next twenty years (10.05% vs 6.32% CAGR). Figure 3 shows that $100 000 invested using the BTSX method in 2000 would be worth $617 194 now vs. $320 550 for the index – that’s a 93% difference!
Figure 3: Sticking with BTSX through rough patches can pay off
The case for dividends
A more subtle but compelling reason to stick with the plan, however, is for the dividends. Stock prices go up and down, flapping in the breeze of market sentiment. Dividends are real cash payments drawn from real company profits – profits that have usually been stable or increasing for years or decades.
At the beginning of 2018, $1 million in the BTSX portfolio would have generated roughly $44 200 in dividend income (annualized). By the end of the year, thanks to dividend increases, that same initial investment would be yielding $46 300 – a 4.8% raise. Investing for dividends is especially effective because it helps the DIY investor ignore the market noise and focus on what really matters: a growing income stream we can use.
Looking forward to 2019
Table 3 shows the list of stocks for 2019 using January 2nd prices (the market was closed on January 1st). Again we see a concentration of telecoms, utilities and financials. Indeed, there is only one change: Manulife has taken the place of National Bank. Depending on how precisely you choose to rebalance, our already minimal transaction fees might be almost non-existent this year.
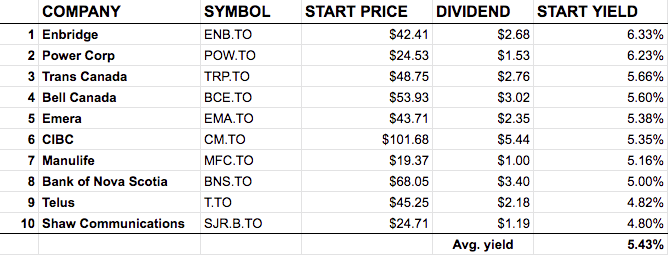
More importantly, due to the recent market declines, our portfolio sports a dividend yield of 5.43% (vs. 3.3% for XIU). If you are lucky enough to have $1 million to invest this year your dividend income could be $54 300! Will that yield get even better if the market continues to decline? It’s likely, but timing the market is a tough game to win consistently and a yield of almost 6% indicates that these quality companies are on sale – a rare event.
In any case, for the purpose of tracking the BTSX strategy, these stocks will be purchased on January 2nd and held for the year. In reality, you may use this list as you see fit – perhaps as a compliment to an index-based portfolio; perhaps diversified with investments in other sectors. The best investment plan is the one you can stick with, so do your own research and reflection. Find what works best with your personality.
Personally, I will be purchasing all of the stocks listed using the BTSX method this year, consciously choosing to focus on the stability of dividend income rather than the volatility of stock prices.