What is the most important spreadsheet for dividend investors? Does it have reams of metrics from payout ratios to dividend growth rates to up-to-the-minute stock price tracking? Does it sort and tabulate and calculate in all the colours of the rainbow?
Everyday investment nerds around the world bask in the bluish glow of their screens, tinkering and tweaking their formulas and cells in an effort to organize and understand. How much of this data is actually useful is up for debate, but this post is about the spreadsheet that I think is the most important for dividend investors: the dividend income spreadsheet.
It’s easy to make.
It’s simple to use.
And it is the most important tool for good investment decision making that I have ever found.
How to make a dividend income spreadsheet
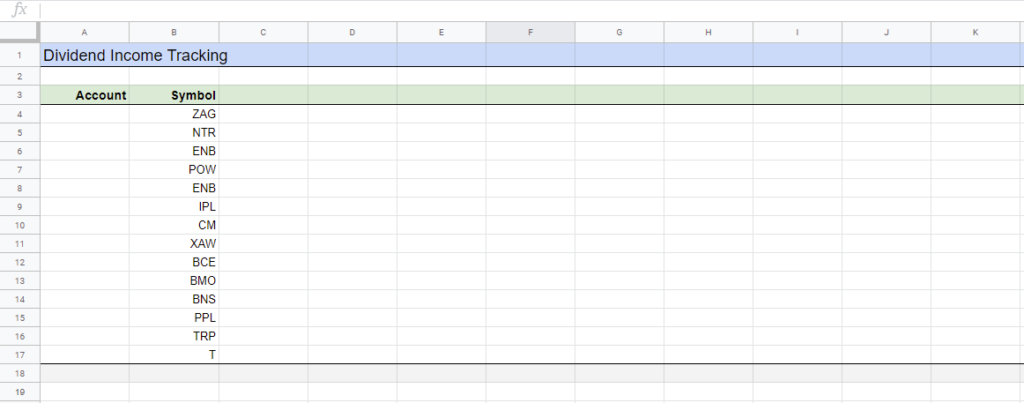
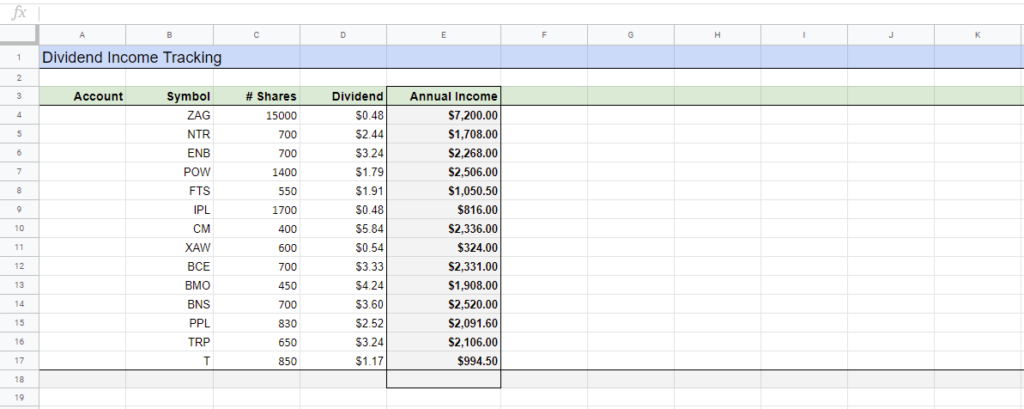
I’ve seen a lot of investment spreadsheets over the years. I’ve made a pile myself (including the complete list of TSX 60 stocks by dividend yield). This is one of the simplest and easiest to set up. In it’s most basic form, this is how to do it (I use Google Sheets – data is hypothetical):
Column 1: List the stocks you own
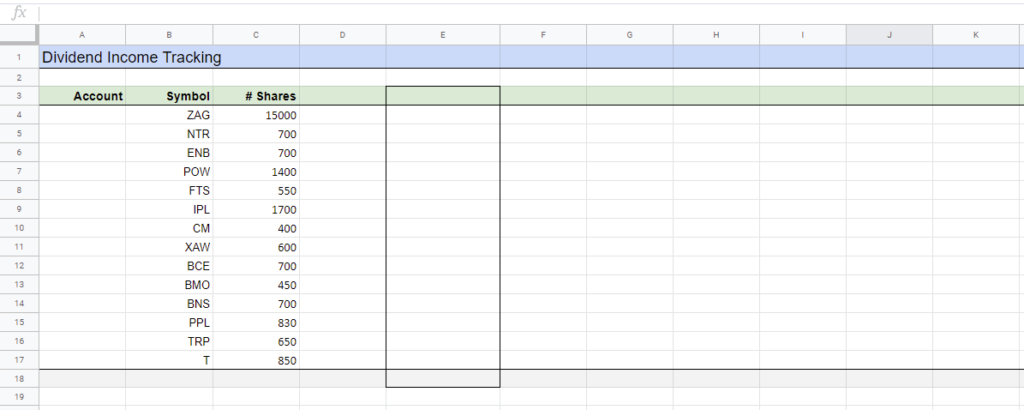
Column 2: Input the number of shares for each stock
Column 3: Input the annual dividend payment per share
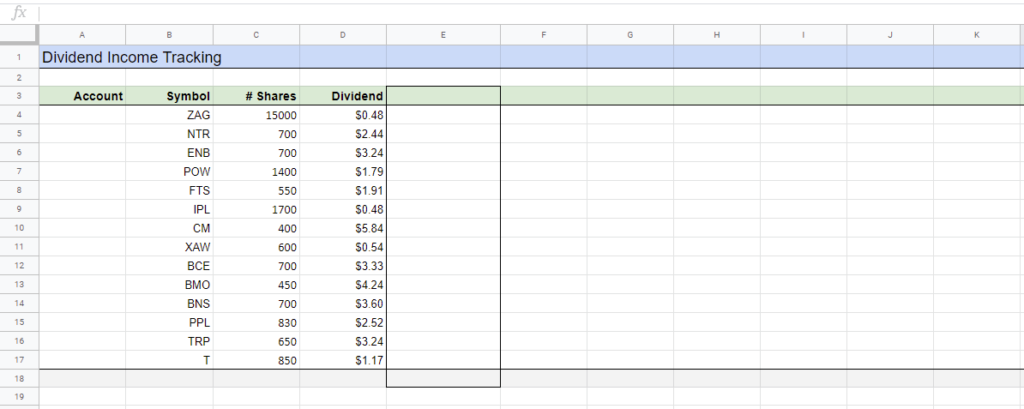
Column 4: Multiply column 2 by column 3 to get the total annual dividend payment per stock (to do this for ZAG, click on the cell and type “=C4*D4”)
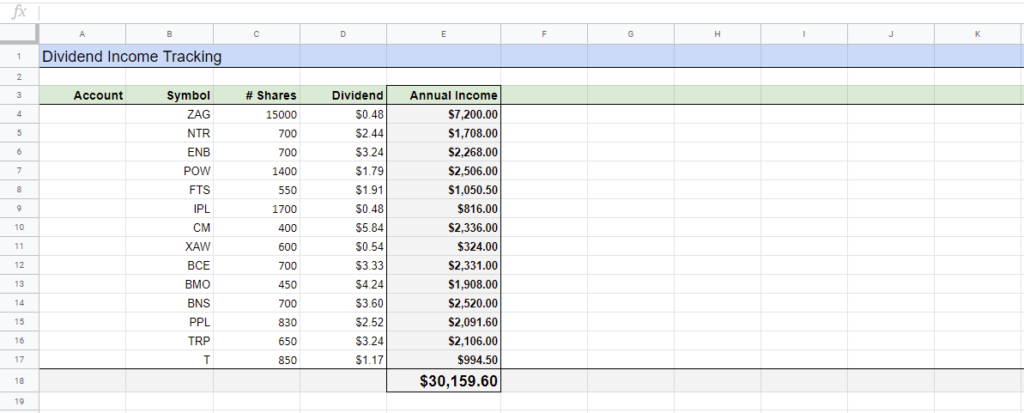
Add up the values in column 4 to get your total dividend income for the year (use the “SUM” function). Make this number big and beautiful.
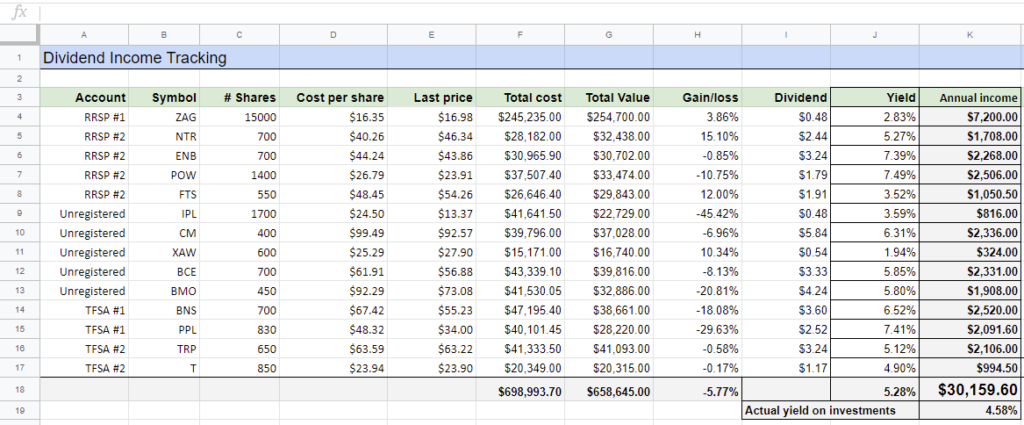
How can you make this spreadsheet even better? Fortunately, it’s easy to add all kinds of interesting data to this spreadsheet to make it even more informative: stock price, book value, current value, dividend yield, yield on cost, total account value, etc.
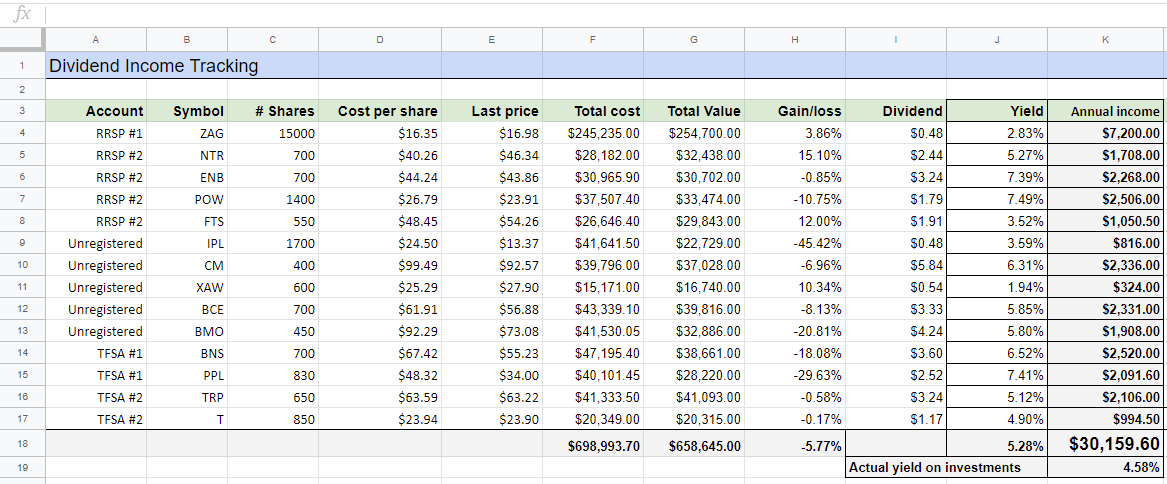
This is what a more detailed spreadsheet might look like (hypothetical portfolio and values) :
No matter how much additional data you choose to include, it’s the total dividend income that is the most powerful cell. I see it like a paycheck I don’t have to work for; it is the money that our money earns. And it is a powerful motivator for good decision making.
Why is dividend income so important?
Dividend doubters sometimes accuse dividend investors of being hypnotized by cash payments. But what we have seen over the past 30+ years of Beating the TSX is that DIY investors have enjoyed both dividends and capital appreciation with a total return that has beat the index by about 3% per year on average.
As long as we are invested in big stable companies who are committed to their dividends, the income is stable. Tempted to hold cash in anticipation of a crash? – that cash won’t pay you anything. Tempted to sell for fear of price declines? – your dividend “paycheck” will take a hit. This spreadsheet puts the right information in the right place, encouraging good habits and discouraging the bad ones.
If market volatility is the disease that tempts us to make bad decisions, for me this spreadsheet is the antidote. It doesn’t matter that Royal Bank’s stock price is down 25%. They haven’t missed a dividend in 20 years, and those payments have grown from $0.56/yr to $4.32/yr in that time. Even more powerful: Royal Bank’s total return over the last twenty years has averaged almost 14% per year. Focus on dividends, enjoy total returns.
Benefiting from a 12% rate of return over multiple decades, as BTSX has done, is not as complicated as many would believe. Similar to healthy living, it requires a little motivation, a handful of the right information, and creating tools that encourage good decision making.
Try it, you might like it
There are a lot of things investors do that are, to be frank, a waste of time: watch BNN, check our portfolios too frequently, try to decipher whether a chart is showing a head and shoulders vs a cup and handle pattern (or is it a double top??). In contrast, I can guarantee that creating a dividend income spreadsheet is worth your time.
Regardless of what investments you hold, try it. You can add all kinds of additional information that you find interesting and/or useful, but for me, seeing our dividend income motivates me to protect and grow it. In the face of market confusion and uncertainty – in no short supply these days – it’s just the cue I need to tune out the noise and focus on what matters. That’s why I think it’s the most important spreadsheet for dividend investors.
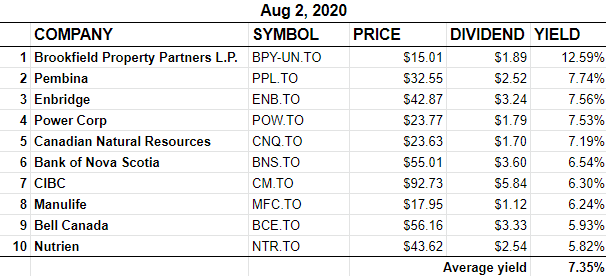
BTSX portfolio for August 2020
Not much activity in the BTSX portfolio this month. No dividend raises and, surprisingly given the market world conditions, no cuts either. As a result, our yield remains high at over 7%.

I notice that the yield column in your spreadsheet shows percentages based on the stock’s current market value. Would your actual yield on that stock not be calculated based on your total cost of that stock, rather than the stock’s current value?
Good question – this is just one of the ways this spreadsheet can be expanded upon. However we word it, these are just two different measurements. One is “current yield” (what I calculated). The other is “yield on cost”. Both are useful, but I think current yield is somewhat more useful in terms of assessing the current state of one’s portfolio. It is also the more common metric referred to when talking about dividend yield and I didn’t want to overwhelm readers with too many variations.
Still, fair point, and it sure is nice to see “yield on cost” grow well into the double digits as years go by.
hi Ivan and admin,
Yield on Cost (YOC) can be a misleading number.
Personal example – I’ve held a position in BCE for a long time (think decades) – it started with 5 shares and was DRIPed – the number of shares is now ~300 and the ACB overall is in the high teens – the YOC on the original position (what was actually invested) is about 500% and on the overall position it’s around 20% – neither number is very useful imo – current yield is more useful as it reflects the return on what the position is worth currently.
For YOC to be useful I’d have to be able to acquire more stock at that price (really tough to do) or to value my position at cost – well no, it’s worth what I can sell it for not what I paid for it.
Put another way using BCE – if the dividend were cut to 1.00 from the current 3.33, the YOC would still be > 100% on my original capital (not bad!) but in reality it only be ~1.7 on the current value – which is the more indicative (better?) metric?
Useful illustration, fbgcai. Yield on cost is a feel-good metric that can also encourage long holding times.
For some reason BMO seems to have dropped off the top ten list. Checked it’s yield this morning at TMXMoney and the yield shows as 5.808% while NTR is at 5.45%.
I’ve been using the free spreadsheet at LibreOffice for a few years now and am quite happy with it. Just another alternative.
Keep up the good work. I always check your BTSX list first before purchasing a stock.
That #10 spot flops around a little. Readers can always access the entire TSX60 by dividend yield here. Or the current BTSX list here.
Is there any way to have the stock price updated from the internet rather than manually whenever I pull up the spreadsheet?
Yessir – use this formula (using Enbridge as an example):
=GoogleFinance(“TSE:ENB”,”PRICE”)
For stocks that have a hyphenated symbol, use a period. For example, BIP-UN would be:
=GoogleFinance(“TSE:BIP.UN”,”PRICE”)
Thank you, but I should have mentioned I use Excel. This doesn’t appear to work with Excel?
After a quick google search, it seems you might be right, but there is a workaround if you are so inclined: https://office-watch.com/2016/excel-stock-prices-from-google-finance/#:~:text=Once%20you%20get%20the%20data,many%20global%20stocks%20and%20indexes.
IMO, it might be easier just to start using Google Sheets – it is free, after all.
I use excel and find it much easier then Google Docs. Type the names of your stocks into a column, then click on data in the toolbar. Highlight the column and click on “Stocks”. This converts all to the name and stock symbol. Then click on the top item and a fill data tab appears on the top right side. Here you choose what you want on your spreadsheet. Then when you have everything in you can refresh it anytime by hitting the Refresh All button. Works really well for me.
If you are still looking at this site – what version of Excel are you using as I do not see those options? Thanks
I use Google Sheets.
Thanks but it was directed really to DivInvestor – sorry. I used the TMX platform, including stock screener, today to source data today and it is a painful exercise. I do not see the options that writer referred to and in Google Sheets and Yahoo Finance, they ask for personal information I do not think they need but know they want in order to make some extra bucks.
As there is no COMMENT section on the TSX 60 page, I note that Kirkland Lake Gold (KL) and First Quantum Minerals (FM) are not in your spreadsheet though included in the index on the TMX website. Neither will be part of the BTSX given their minuscule dividend rate so not really a big deal. Cheers
Thanks for the clarification.
Re the TSX 60 spreadsheet on this site, you are right – I had somehow missed the KL addition about a year ago; the sheet has been updated now. FM was already there, but easy to miss with it’s tiny 0.04% dividend 🙂
Nice job with a simple format, I have done many for our investment and will probably do many more in the future. One spreadsheet I don’t see done well is one that deals with dividend income in a RRIF account as it has a lot of moving parts. Like an increasing minimum withdrawal balanced against dividend income . The one on Tax Tips.ca comes close but only deals with portfolio total return. Keep up the good work.
Good starting worksheet and as you say it’s the total income your investments generate that is important. We have a separate worksheet where every purchase and dividend paid is recorded, by date. The total from those worksheets are linked to a Summary worksheet, similar to the one above. But it shows each stock, sub-totaled by account. The Summary headings are:
Tot Investment, Orig Shares (Purchases), Div Shares (reinvestments), Tot Shares, Ave Cost, Ann Div, Yid on Tot Inv, Yearly Div, Qtr Div, Curr $, Curr Value, Gain (Loss).
I only enter current price at the end of the year, but don’t care if the value is up or down. Totally agree that’s it’s the Total Income that is important and I like Yield on Total Investment, because it does rise slowly as my income rises. I have no interest in current yield and would only consider it if I was purchasing. But as we are retired we don’t add new funds.
Hi Henry. I can see from browsing your blog that we very much agree on this point among others: it is the income our investments generate that is important. We live in an era where the average investor is hyper-focused on capital gains, betting that someone in the future will be willing to pay more than what is payed today. But stable, growing dividends, as out-of-fashion as they may be, are the surest path to financial independence that I have found.
I like the additional spreadsheet features that you have outlined – next level stuff for those who are ready for a little more complexity.
Looking forward to reading your book.
Pingback: Beating the TSX 2020: looking back and staying the course —
Thanks so much for posting this! Do you know if there’s a way to import the dividend into the sheet?
Not that I am aware of, unfortunately