How did your investments perform in 2019? Some will be surprised that it was such a good year. The S&P/TSX Composite Index returned about 22% including dividends. The bad news for mutual fund investors is that, as usual, the vast majority of actively managed funds performed worse than the index – so much for “professional” management. But what about “Beating the TSX” – was it able to live up to its name? Here’s the data:
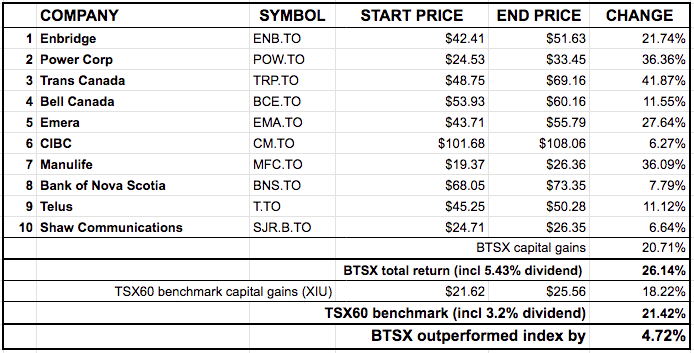
“Beating the TSX” did indeed live up to its name in 2019, beating the TSX 60 by 4.72% based on total returns (capital gains and dividends) – a 22% advantage over the index. This is a welcome turn-around after a slightly disappointing 2018.
Still, it’s the long game that matters and the long term performance of BTSX is nothing short of remarkable. Even though I’ve been using the strategy for over a decade, I am still amazed at the BTSX track record.
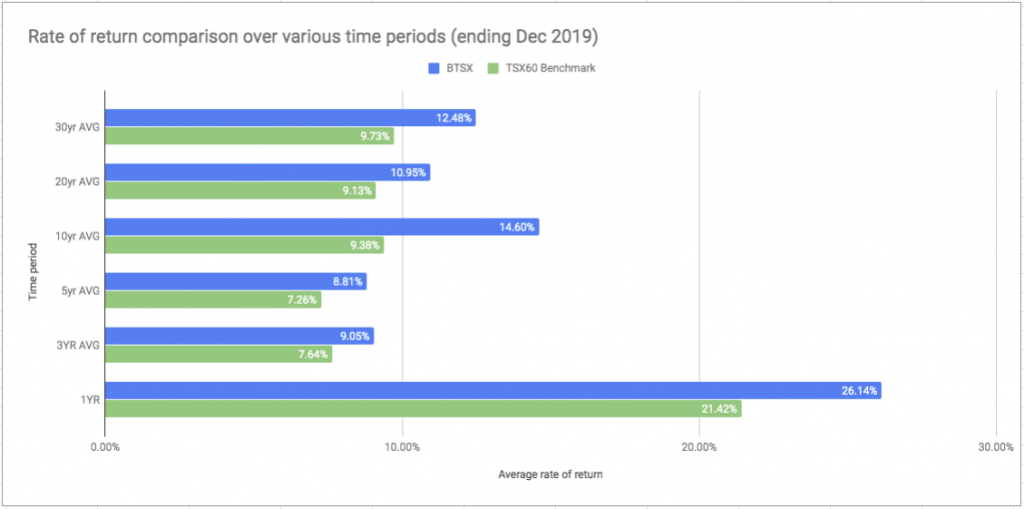
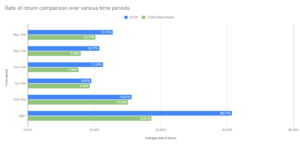
In an era of index ETF Couch Potato investing where it is blasphemy to mention beating the index, we are doing just that. No matter what time frame one chooses, from a year to thirty years, BTSX has outperformed the index. I have not been able to find a single professionally managed fund accessible to the average Canadian investor with this kind of record.
Why does BTSX work?
Perhaps we don’t require an explanation in light of the performance data, but I will give it a shot. To beat the index there must be characteristics of these companies that make them better-than-average investments. Here is what I think those characteristics are:
- profitable
- investor-focused
- boring
Let’s take these reasons one by one.
Profitability
First of all, Beating the TSX selects stocks from the TSX 60 index which is comprised of the largest and most established companies in Canada. Unlike many smaller companies that are engaged in the risky (and costly) process of trying to establish themselves in the marketplace, BTSX stocks tend to be mature and profitable year after year.
Investor-focused
Mature businesses also tend to be investor-focused rather than growth-focused. In contrast, many of the companies trading on the S&P/TSX Composite have negative earnings and small cash reserves; any profits they have are plowed back into the business in hopes of larger profits down the road. Buying such stocks is buying hope. Beating the TSX, on the other hand, selects for large, profitable companies that have shown a commitment to returning earnings to shareholders on a regular basis in the form of dividends. Buying these stocks means buying a steady income of real profits.
Boring
BTSX has a stellar long term record but it is exceedingly unlikely that the this portfolio will ever double in value in a year. Ours is a strategy of base hits, not home-runs. Swinging for the bleachers is a good way to strike out; sure, you’ll enjoy a few thrilling moments, but you’ll lose in the long run. Perhaps that’s why BTSX is not in widespread use – it’s too boring.
BTSX stands out
I’m not the only one touting the benefits of dividend investing in Canada – even the big banks know that dividend paying stocks outperform – but as far as I know, Beating the TSX has the longest verifiable record of superior returns in the Canadian market. Furthermore, it is a method that anyone can follow.
Of course, future results are not guaranteed but the factors that make BTSX work are durable; regardless of market trends and investor sentiment, these companies should continue to be profitable, investor-focused, and boring. No one should blindly follow an investment strategy expecting the future to mimic the past – please do your own research. But I am just as comfortable investing in BTSX stocks now as I was ten years ago.
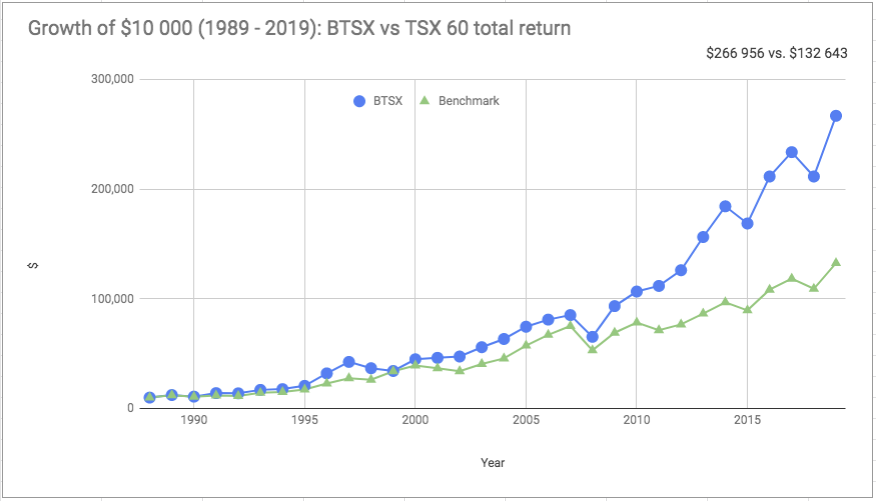
After 30 years 2.75% equals 100%
By now we’ve all likely seen the horrifying charts illustrating how a measly 2.5% mutual fund MER can crater one’s wealth over time. It should come as no surprise then that the same principle of compounding applies in reverse. Over the last 30 years, BTSX has beat the index by 2.75% (geometric average). This might not sound like much, but the effect is huge: after 30 years, the BTSX method would have accumulated twice as much wealth as the benchmark index fund.
Some other benefits of BTSX
One might assume that results like this require unusual skill and a high workload. Wrong. BTSX is easy to understand and simple to execute. The portfolio and how it is generated is freely available to everyone.
Some might think that high returns must be paired with gut-wrenching volatility. Wrong again. Dividend paying stocks, and BTSX stocks in particular, have lower than average volatility.
What about the risk of dividend cuts? Of course, this risk is real and does happen on occasion to BTSX stocks, but more often than not BTSX stocks raise their dividends rather than lower them. In 2019, eight of the ten stocks raised their dividend during the year; overall dividend income increased 5.23%. This is in line with what we’ve come to expect from BTSX stocks (last year dividends rose by 4.8%) and more than compensates for inflation.
BTSX portfolio 2020
Looking forward to 2020, here is the BTSX portfolio:
Summary
- BTSX out-performed the benchmark TSX 60 index by 4.72% in 2019 (total return)
- BTSX has out-performed its benchmark over the last 3, 5, 10, 20, and 30 year time periods
- The factors that make BTSX effective are durable; its advantage over indexing is not by chance and will likely continue
- Beating the TSX is a simple, low-maintenance strategy that is accessible to all investors


So where are the BTSX stocks for 2020?
They were published at the end of the last post, but I will add them to the end of this post too since I’m sure others are also looking for them. Thanks for the suggestion.
Hi Matt, Thank you for the summary and yes the BTSX has done well (yet again). I also have DRIP ‘d most of the holdings and that adds a compounding effect at no commission and generally favorable DRIP share prices. The underlying banks (BNS & CM) have been struggling a bit and are off from my purchase price. That said, I have been writing covered calls against the banks and that makes up a bit. Thanks for all the effort you put into your notifications. Geoff
Hi Geoff, thanks for the comment and good point re the added benefit of DRIPs.
Great summary and proof that the “Beating the TSX” method works.Thanks for the post.
You’re welcome
There is a series of 5 videos on Youtube, uploaded by Canadian Moneysaver magazine, presented by David Stanley, the originator of the BTSX strategy, I believe, and your predecessor (Matt) at the Canadian Moneysaver magzine, which explain the Beat the TSX strategy. These videos are about 5 years old, yet the same strategy is used, some of the same stocks today are in the 2013-2014 portfolio as shown in one of the videos. Interesting background to strategic investing. Interesting to see the stock prices from that time.
One other thing David Stanley did mention in one of the videos is the Dogs of the Dow, information can found about these stocks at https://www.dogsofthedow.com/.
Al
BTSX is based on the Dogs of the DOW method, although our results in Canada are better than those in America. There are numerous reasons why this might be true.
David Stanley has more knowledge and experience with BTSX than anyone and he’s a great speaker too. Those YouTube videos are definitely worth watching. Here is a link to the first one: https://youtu.be/9s0UJkn3jeM
Thanks for the links, Allen.
I pretty much follow the BTSX and my overall investment (money weighted) return for 2019 was 25.9%. One of my accounts with fewer holdings returned 33.4%.
Instead of Shaw and Manulife, I hold AT&T and SunLife.
So far, so good.
So far, so great
Akin to BTSX chart listed above, where would one find the same data for all TSX 60 stocks?
That information was very difficult to find elsewhere so I made this:
https://dividendstrategy.ca/tsx-60-stocks-by-dividend-yield/
Brilliant! Thx – curious to know data source.
I use Google Sheets which I have configured to pull the data from Google Finance. The part that doesn’t populate automatically is the dividend, so I update those manually as often as possible from Yahoo Finance.
There are two methods I use to get TSX 60 quotes:
1) log in to TMX money, create an account there (Portfolios/Alerts) and enter the stocks into a portfolio, split the number of stocks in two, as the maximum number of stocks per portfolio is less than 60, these two portfolios can be exported into excel files for further manipulation, or
2) go to the portfolio tab in ca.investing.com, create a portfolio of the TSX 60 stocks, they can then be downloaded into an excel file, which can be ediited to create a report to your liking.
I believe Matt uses numbers from Yahoo Finance to get his quotes.
Any of these options should give you the numbers you need to track stock performance.
Al
ps if you create a TSX 60 Stock portfolio under the portfolio tab in ca.investing.com, one of the options you can display is performance numbers. yield is one of the options in the display of performance numbers, you can create your own list of TSX 60 stocks sorted by yield, highest to lowest, to create your own BTSX list of stocks. saves a lot of manipulation of the numbers in excel.
Thanks – appreciated!
Hello, would it be possible to get the BTSX holdings and one year return for 2018, 2017, 2016 and 2015 for BTSX and the XIU? Similar to the first table in your article above?
Thank you
Here is the performance data:
YEAR BTSX BENCHMARK
2015 -8.50% -7.60%
2016 25.40% 21.00%
2017 10.50% 9.30%
2018 -9.50% -7.80%
2019 26.14% 21.42%
I don’t have the stock lists handy, but they are available in the Canadian MoneySaver archives.
2015 – initial stock list: TCK.B, BCE, CVE, CM, RCI.B, NA, BNS, POT, BMO, PWF(POW), TCK.B and CVE were replaced in the portfolio during the year due to dividend cuts, they were replaced by SJR.B and TRP respectively, note that Ross Grant, writer of the BTSX column at the time (2015) replaces PWF with POW if PWF appears on the top 10 list. Performance of the portfolio was -8.5% compared to the performance of XIU of -7.8%, as noted above.
2016 – initial stock list: POT (replaced by BMO after dividend cut), NA, CM, BNS, SJR.B, BCE, PWF(POW), ENB, TRP, T, again note that Ross Grant replaced PWF with POW. Performance of the portfolio was 25.4% compared to performance of XIU of 21.0%.
2017 – stock list: BCE, PWF(POW), EMA, CM, T, SJR.B, NA, BNS, FTS, ENB, again note the PWF/POW switch. Performance of the portfolio was 10.5% compared to performance of XIU of 9.3%.
2018 – Stock list: ENB, EMA, PWF(POW), BCE, CM, T, SJR.B, TRP, BNS, NA, again note the PWF/POW switch. Performance of the portfolio was -9.5% compared to XIU performance of -7.8%.
2019 – you can find the numbers and stocks for 2019 on this website
2020 – information on this site
Interesting to see the stocks that end up on the selection list every year.
Al
Hi – thanks for the update- much appreciated.
Do you sell all stocks each Dec 31, and then buy all stocks Jan 2? If so, are any dividends lost?
Thanks – Brian
The short answer is no. This post will be helpful in filling in the details: https://dividendstrategy.ca/how-to-use-btsx-in-real-life/
Let me know if you have any other questions, Brian.
First of all, Thank You for sparing your time in sharing such a great strategy with others in a selfless manner. Awesome indeed.
I have some noob questions too, please let me know your views.
1. if you manage to find cash in Jan 2020, will you buy these stocks at whatever prices or will you hesitate or will you prefer dollar cost averaging?
2. How exactly do you calculate yield on your portfolio for a calendar year considering that you already have a big portfolio? Do you calculate total value on a date and then recompute value 12 months later?
3. In last 5 years, IPL price has dropped from $33 to $22. How do you convince yourself to invest your hard earned money in such equity?
Hi Comet, thanks for stopping in. Great questions. I’ll point you in the direction of my answers.
1. Here is a post discussing the options investors have when they are sitting on cash: https://dividendstrategy.ca/is-it-a-good-time-to-invest-in-the-stock-market/
2. All the data I use to calculate the total return for both BTSX and the benchmark are published on this site and in the Canadian Moneysaver magazine. We assume an equal weighting of all ten stocks and take the sum of capital gains (or losses) plus dividends. If you are referring to my personal portfolio, I use the XIRR function in Excel. I wrote an article for the Canadian Moneysaver a few years back on how to do this. Perhaps I will re-write it for the blog if it would be helpful.
3. In my opinion, a big, profitable company with a strong dividend history that has dropped in price is more likely an opportunity than a threat. Here is my take on IPL: https://dividendstrategy.ca/does-ipl-belong-in-btsx-june-2019-btsx-update/
https://www.newswire.ca/news-releases/s-amp-p-dow-jones-indices-announces-changes-to-the-s-amp-p-tsx-composite-and-s-amp-p-tsx-60-indices-834691173.html
ECA is gone, BPY.UN added to TSX 60 stock list, as of Jan 24, 2020
I was listing numbers from the TSX 60 today and noticed that OVV was in the list. ECA has been renamed to OVV, and removed from the TSX 60, and was replaced by BPY.UN. Based on the yield numbers, this may affect selection of stocks for your BTSX list.
Al
Thanks a million, Al. You caught this before I did. Spreadsheets have been updated. Fortunately, doesn’t affect our BTSX portfolio.
EDIT: In fact, BPY-UN has a yield of 7%, so it will be included in this month’s BTSX portfolio. My apologies.
Hi Matt, just wondering why isn’t BPY.UN included in the BTSX portfolio?
Somehow I missed that BPY.UN had a 7% dividend when I first replied to Al’s comment. It will be included in the updated BTSX list. Sorry for any confusion.
Hi Matt, When you say “Purchase these equities in equal parts”, do you mean the same amount of cash for each of the top 10 or equal amounts as in for example 500 shares for each stock. And if so, wouldn’t that make your higher cost stocks like CM for example make you go over your 5% of your total portfolio let’s say. Can you please advise? Thank you very much.
Hi Dan, “Purchase these equities in equal parts” means equal dollars, not equal shares.
Hi Matt
Would you mind giving me an example of how you calculate the % return from the dividend (the 5.43%) in the line “BTSX total return (incl. 5.43% dividend)” in the results of the 2019 table?
Thanks so much
Hi Phil, very simple: 5.43% was the average yield of the BTSX stocks at the beginning of 2019, just like 5.27%, the average yield of our 2020 portfolio, will be used at the end of 2020.
Pingback: Coping with a market correction —
Pingback: Why is the stock market crashing? —
Pingback: 10 advantages DIY investors have over the pros —
Pingback: 10 advantages DIY investors have over the pros | BMG DIY Investor
Hi Matt,
Thanks a lot for all your hard work… this is a very valuable resource…. any idea when the list for 2021 will be published.
thanks!!
Thanks for the kind words. I will be posting a recap of 2020 along with the official 2021 list as soon as possible in January 2021. In the meantime, you can always find the current top 10 yielding stocks of the TSX 60 here:
https://dividendstrategy.ca/btsx-portfolio/
Pingback: Beating the TSX 2020: looking back and staying the course —